I graduated from Full Sail. I was also the Advanced Achiever for my class, which is a combination of honor roll and class president (neither of which the school officially has). So now I am, quite literally, a Master of Game Design - I'll even get a shiny piece of paper that says so in six-to-eight weeks.
So, with my newfound post-school free time and official mastery, I've begun gearing up for my NAWTS project over the past few days - organizing my games and doublechecking the spreadsheet for missed entries (of which there were a few). Since I was mucking about in the spreadsheet anyhow, I decided to do a little more statistics with it.
 |
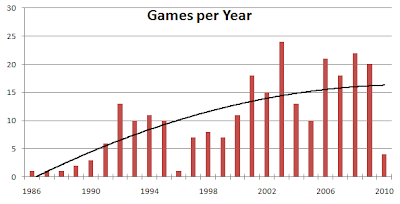
| The video games I own, grouped by year of release, with a best-fit second-polynomial line overlayed. |
For the record, the best-fit line is a second-polynomial curve - I just wanted to observe the most general trend; I can see the ups and downs from here, thanks.
Speaking of those ups and downs, it's pretty clear to see that the graph doesn't actually 'fit' this best-fit line very well. The most important thing to remember in dealing with those lines is that this data regards the release dates of the games I own, not the date I purchased them: if I buy a used video game in the year 2006, but the game itself was first released in 2003, then it goes in the 2003 column. Another thing to note is that the whole of the data comes from my own memory, and as such may well be incomplete, especially when it comes to earlier games for less popular systems.
Still, that's probably not enough to account for everything in the chart. Perhap the biggest, most glaring issue is the year 1996. Seriously, what happened there? Even if I was just buying used games throughout that year - which I'm pretty sure I wasn't, since at the time I would have been a Electronics Boutique shopper and not a Gamestop or Funcoland shopper - that doesn't explain why I didn't go on in later years to buy used games that were released in 1996. In fact, the only video game I own that was released in 1996 is Super Mario 64! I'll grant that it's an impressive, sprawling game, and that it could well have occupied me completely, but it only came out in the fall of that year alongside the Nintendo 64 itself.
As with all questions in life, my first step is to turn to Wikipedia. Sure enough, they've got a lot of info ready for me already on video games in 1996. Apparently, that year was a big one for new consoles - the Playstation and Sega Saturn had just launched, and the N64 was about to drop. It's not that notable games weren't released - Crash Bandicoot, Tomb Raider, Diablo - but they just weren't games I was interested in at the time. I remember a number of games from that year, too, like Super Mario RPG and Mega Man X3, but these were games that I rented multiple times instead of purchasing.
The next biggest dip is, surprisingly, this year - 2010. This also probably has similar explanations, mainly being that I was deeply involved with school for the vast majority of the year. Even though I did buy a few games upon graduation, they were all older titles, either used or on Steam. Also, because games released this year haven't had much of a chance to be turned in used or find their way to the clearance bin, I haven't had the extra oomph of a really low price to push me to buy more of them. Additionally, I didn't have many of the consoles of this era: I only just picked up an XBox 360 on Black Friday (really Saturday), I still don't own a PS3, and my Wii is back at my parent's home. Obviously, without the consoles to play freshly-released games on, I'm not going to buy many games.
Finally, what's up with 2003? It's a huge spike, especially over the best-fit line. It's likely explained by the fact that a number of systems hit that I picked up very quickly: the Game Boy Advance, the GameCube, and the Playstation 2. Between buying titles at launch and buying used titles later on, for three prolific systems, it's easy to see why I got so many games from that year.
Still, it's cool to see some reflection of my game-buying habits in graph form - and remember, this is a reflection, not a direct measurement, because it looks at a game's release date instead of the date of my purchase.